Visualising Regenerative Agriculture to Life - One Conversation at a Time
When I was invited by TABLE initiative (Environmental Change Institute, University of Oxford) to support the Reckoning with Regeneration project, I knew it would be an interesting brief.
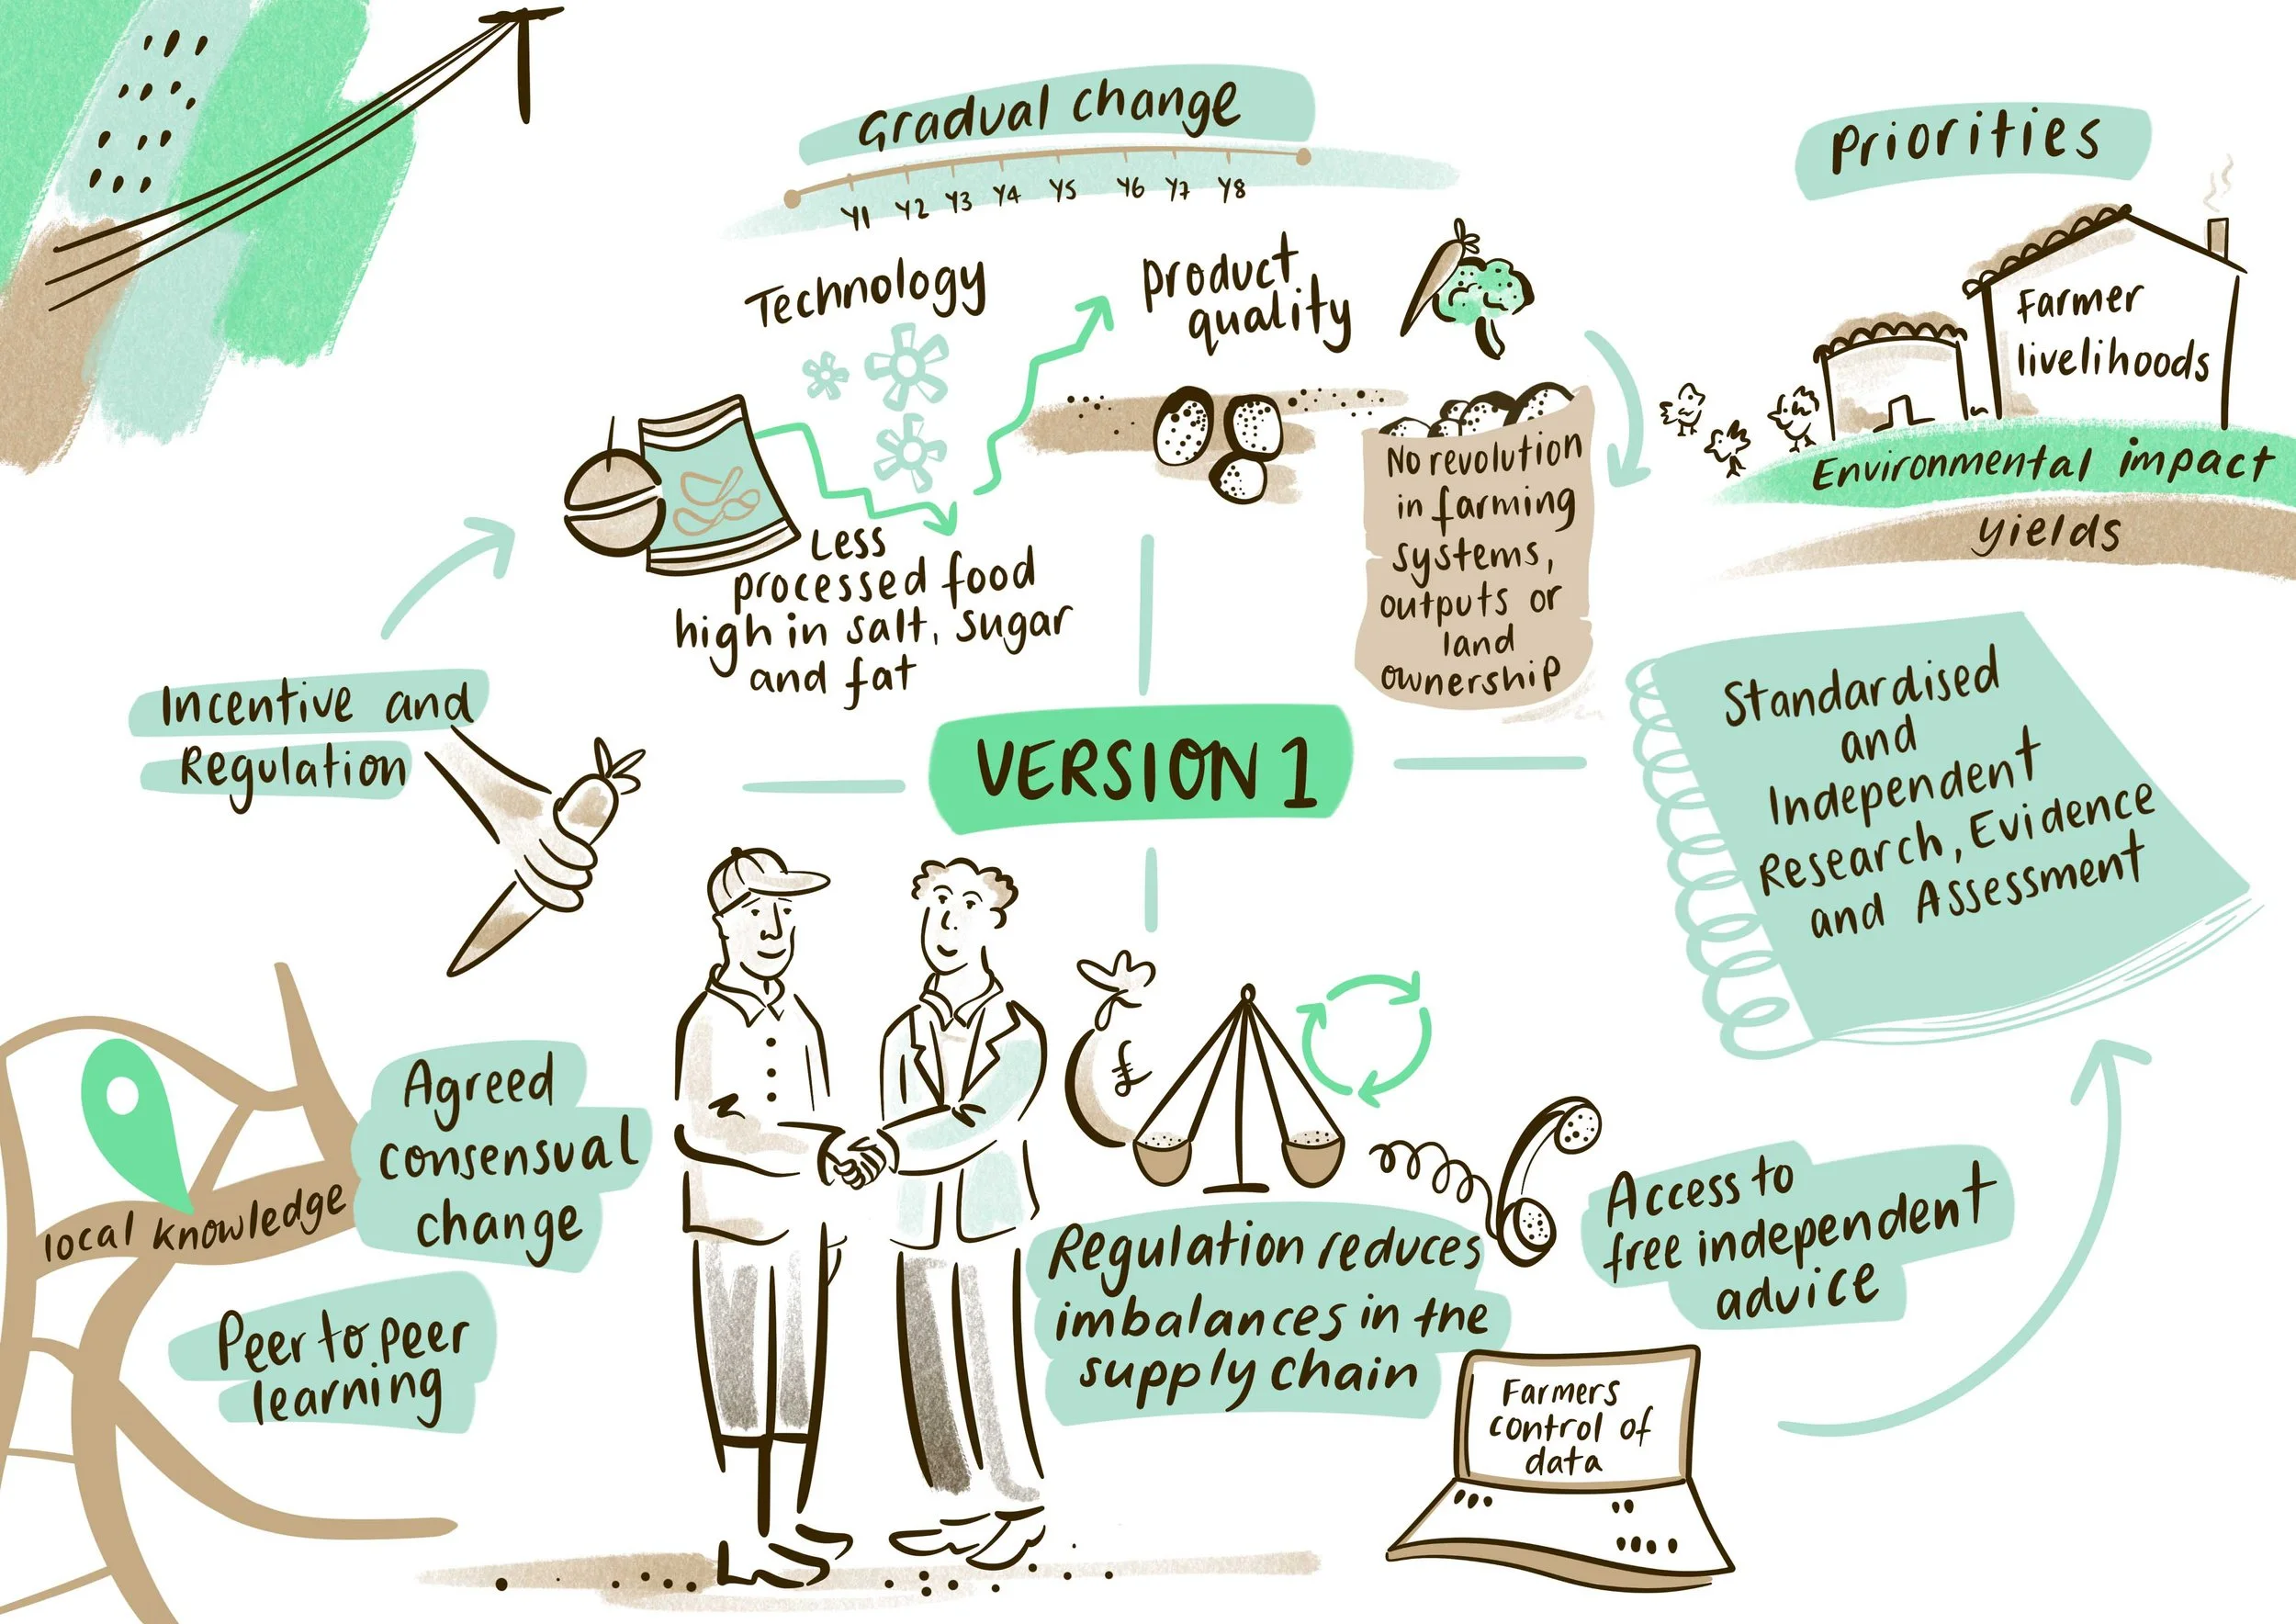
The goal was to create a set of illustrations that could help make sense of the many different versions of “regenerative agriculture” emerging across the food system. Versions that bring together values, practices, risks and hopes… but don’t always agree with each other. My job was to help make those differences visible without flattening or simplifying them.
From the beginning, this felt like a deeply collaborative process. I spent time with the project team to understand the bigger picture, and then joined a live workshop where around 50+ people came together to explore different approaches to regenerative farming. As the conversations unfolded, I was in the room capturing themes, tensions, big ideas and visual metaphors to convey the nuanced ideas. That live experience gave me a strong foundation to start shaping the first drafts of the visualisations.
Infographic by Esther Springett for Oxford University
After the workshop, I worked closely with the team and key stakeholders to review and refine the drafts. We met to talk through what landed, what needed more clarity and what could be emphasised to provoke greater debate.

Infographic by Esther Springett for Oxford University
The final visuals aim to represent 4 ‘versions’ of regenerative agriculture. Each one brings a different set of values, priorities and trade-offs to the table. They’re designed to support future workshops, inform publications and help spark wider conversations in the sector. I’m excited to share the finished illustrations and I’m really proud of how they capture the richness of the different debates around regenerative agriculture.

Infographic by Esther Springett for Oxford University
Thanks to Richard, Ruth and Tara from TABLE, University of Oxford for bringing me on board. You can read more about this project here.

Infographic by Esther Springett for Oxford University
You can find out more about my Infographic service here!